Papers With Code shut down, and with it went the only public answer to a question that matters more every year: when a paper describes something useful, does anyone actually build it?
We index 100,081 papers alongside the models that cite them, so we can answer it. The answer is worse than the field's mood suggests, and improving faster than its critics do.
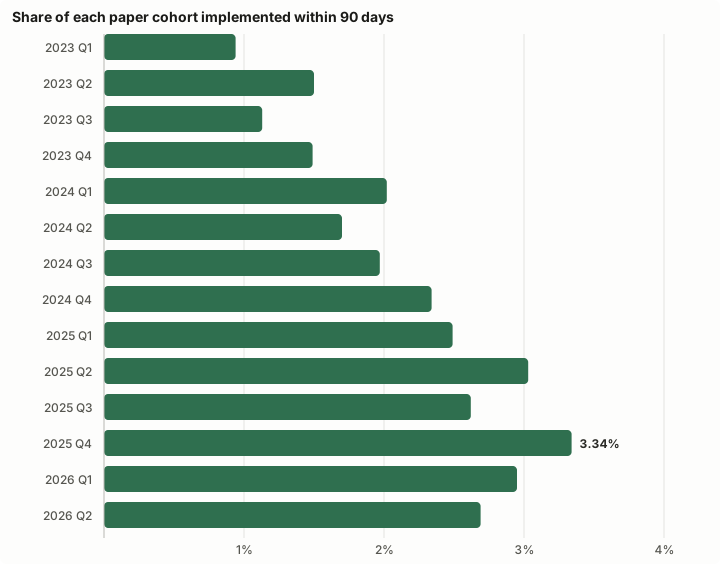
Share of each quarterly cohort of papers with a model citing them on the Hub within 90 days of publication. 77,686 papers across 14 quarterly cohorts, 2023 Q1 to 2026 Q2. Read from the index on 12 September 2026.
The rate, by cohort
Every paper published in a quarter, measured against whether a model citing it appeared on the Hub within ninety days of publication. Same window for every cohort, so nothing here is an artefact of recent papers having had less time.1
| Cohort | Papers | Implemented in 90 days | Rate | Within 30 days |
|---|---|---|---|---|
| 2023 Q1 | 2,446 | 23 | 0.94% | 16 |
| 2023 Q2 | 4,010 | 60 | 1.50% | 33 |
| 2023 Q3 | 3,730 | 42 | 1.13% | 24 |
| 2023 Q4 | 4,780 | 71 | 1.49% | 53 |
| 2024 Q1 | 5,010 | 101 | 2.02% | 68 |
| 2024 Q2 | 5,057 | 86 | 1.70% | 56 |
| 2024 Q3 | 4,456 | 88 | 1.97% | 57 |
| 2024 Q4 | 5,935 | 139 | 2.34% | 101 |
| 2025 Q1 | 6,577 | 164 | 2.49% | 109 |
| 2025 Q2 | 7,163 | 217 | 3.03% | 176 |
| 2025 Q3 | 6,342 | 166 | 2.62% | 120 |
| 2025 Q4 | 6,640 | 222 | 3.34% | 168 |
| 2026 Q1 | 8,080 | 238 | 2.95% | 179 |
| 2026 Q2 | 7,460 | 201 | 2.69% | 139 |
Three and a half times the 2023 rate at the peak. Also: 96.66%.
Four things this says
The absolute number of reproduced papers has grown tenfold. Twenty-three papers from 2023 Q1 had a model within ninety days. Two hundred and thirty-eight from 2026 Q1 did. The field is not merely publishing more; it is building more, and faster.
Publication volume grew faster than reproduction. 2,446 papers a quarter became 8,080. The rate improved from 0.94% to around 3%, which means the pile of unimplemented work grew from roughly 2,400 papers a quarter to roughly 7,800. If your model of the field is "too much is published for anyone to read", this is that, quantified: the unread fraction is not shrinking, it is compounding.
When a paper does land, it lands in days. Among papers implemented inside the ninety-day window, the median has fallen from 25 days for the 2023 Q2 cohort to 6 days for 2025 Q4 and 2026 Q1, and 8 for 2026 Q2. There is no middle speed any more. Either something appears within a fortnight or it does not appear at all.
The 2026 decline is real in the data and probably not real in the world. 2.95% then 2.69%, against 3.34% in 2025 Q4. Quarters whose ninety days have not elapsed are excluded, so these are complete measurements — but they are the newest complete ones, and that matters here. A paper is counted as implemented when a model card links it, and those links are added by uploaders whenever they get round to it, often months late. Every cohort's number therefore rises for a while after its window closes. The oldest cohorts have finished rising; the 2026 ones have not. Read the last two quarters as a floor that will move up, and read the fact that we can say which direction it will move as the point: we re-run this every day and the number is dated.
What actually gets built on
The papers with the most models built on them are not the frontier reports.
| Models built on it | Paper | Published |
|---|---|---|
| 3,955 | Sentence-BERT: Sentence Embeddings using Siamese BERT-Networks | 2019 |
| 1,897 | Efficient Natural Language Response Suggestion for Smart Reply | 2017 |
| 1,175 | Scaling Speech Technology to 1,000+ Languages | 2023 |
| 878 | Multilingual E5 Text Embeddings | 2024 |
| 793 | Measuring Massive Multitask Language Understanding (MMLU) | 2020 |
| 766 | Matryoshka Representation Learning | 2022 |
| 745 | HellaSwag: Can a Machine Really Finish Your Sentence? | 2019 |
An embedding architecture from 2019 has more models built on it than any paper published since. Four of the seven are evaluation sets rather than methods — people cite the benchmark they scored on, and the benchmark accumulates citations for a decade.
The durable objects in machine learning are embeddings and benchmarks. Everything else is weather.
What this number is not
It is a floor, and we would rather say so than have someone else point it out.
The arXiv link on a model card is typed by whoever uploaded the model. If citing habits improved between 2023 and 2026 — and among a population that has professionalised as fast as this one has, they plausibly did — then some of the rise is better bookkeeping rather than more building. We cannot separate those two effects from this data, and neither can anyone else who has tried.
What survives the objection is the shape: the rate rose every quarter but one across fourteen quarters, the median lag collapsed, and the unimplemented majority stayed a majority. A bookkeeping artefact would be unlikely to produce all three at once.
Footnotes
-
trend_implementation_rateinpipeline/flights/derive_trends.py, read 11 September 2026. The window is fixed at ninety days per cohort because averaging the raw lag by publication year produces a collapse from 1,918 days in 2018 to 6 days in 2026 that is almost entirely censoring — a paper published this year cannot exhibit a five-year lag. Cohorts start in 2023 because our model corpus contains nothing created before 2022. Quarters whose ninety days have not elapsed are excluded. ↩